Topics
Core Concept: Split-Apply-Combine pattern
- Split: Data is split into groups based on criteria (column values, index levels)
- Apply: A function is applied independently to each group (aggregation, transformation, filtering)
- Combine: Results are combined into a new data structure (DataFrame or Series)
Basic Setup
import pandas as pd
import numpy as np

# Sample DataFrame
data = {'Category': ['A', 'B', 'A', 'B', 'A', 'C'],
        'SubCat': ['X', 'X', 'Y', 'Y', 'X', 'X'],
        'Value1': [10, 20, 30, 40, 50, 60],
        'Value2': [1, 2, 3, 4, 5, 6]}
df = pd.DataFrame(data)
Grouping
Single column: df.groupby('Category')
Multiple columns: df.groupby(['Category', 'SubCat'])
Get specific group: grouped.get_group('A')
View groups (useful for small datasets):
# Example: Print groups and their indices
for name, group in df.groupby('Category'):
     print(name)
     print(group)
Note
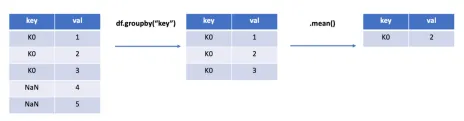
In
groupbytheNaNis automatically excluded.
Aggregation
Apply functions to reduce group data to a single value per group.
Single aggregation function:
# Sum of Value1 for each Category
sum_val1 = grouped_single['Value1'].sum()
# Mean of all numeric columns for each Category
mean_all = grouped_single.mean(numeric_only=True)
Common aggregation functions: count() (non-na count), size() (group size including na), sum(), mean(), median(), min(), max(), std(), var(), first(), last(), nunique() (unique count).
Multiple aggregations with agg() / aggregate():
# Multiple aggregations on a single column
agg_single_col = grouped_single['Value1'].agg(['sum', 'mean', 'count'])

# Multiple aggregations on multiple columns (using dictionary)
agg_multi_col = grouped_single.agg({
    'Value1': ['sum', 'mean'],
    'Value2': ['min', 'max']
})
Named aggregations (Recommended for clarity): Define output column names
named_agg = grouped_single.agg(
    TotalValue1=('Value1', 'sum'),
    AverageValue1=('Value1', 'mean'),
    MinValue2=('Value2', 'min'),
    Count=('Category', 'size') # Can aggregate on the grouping key itself
)

# Common ops: group by + sorting
print(
  grocery.groupby("product_description").agg(
    avg_price = ("price","mean"),
    total_sales = ("sales_quantity", "sum")
  ).sort_values(
    by="total_sales",
    ascending=False
  )
)
Custom aggregation function:
def range_fn(x):
    return x.max() - x.min()

custom_agg = grouped_single['Value1'].agg(range_fn)
# Using lambda
custom_lambda_agg = grouped_single['Value1'].agg(lambda x: x.max() - x.min())

grouped_single.agg(
    range_ptp=('Value1', lambda x: x.max() - x.min()),  # custom func
    avg=('Value1', 'mean'),
)
Pivot tables for aggregation
An alternative to groupby for multi-dimensional aggregation
pd.pivot_table(df, index='department', columns='region', values='sales',
               aggfunc='sum', fill_value=0)
This produces a table of total sales by department (rows) and region (columns).
Transformation
Apply functions that return Series/DataFrame with the same index as the original group. Useful for standardization, filling missing values within groups.
transform(): broadcasting results back to the original shape.
# Z-score normalization within each Category for Value1
zscore = lambda x: (x - x.mean()) / x.std()
df['Value1_ZScore'] = grouped_single['Value1'].transform(zscore)

# Fill NA with group mean
df['Value1_Filled'] = grouped_single['Value1'].transform(lambda x: x.fillna(x.mean()))
Filtering
Remove entire groups based on a condition applied to the group data.
filter(): Keep groups where the function returns True.
# Keep groups where the sum of Value1 is greater than 50
filtered_groups = grouped_single.filter(lambda x: x['Value1'].sum() > 50)

# Keep groups with more than 1 row
filtered_size = grouped_single.filter(lambda x: len(x) > 1)
Other Useful Operations
Reset index: Convert grouped output back to a flat DataFrame.
agg_reset = named_agg.reset_index()Apply arbitrary function: apply() is flexible but can be slower. It takes a DataFrame chunk for each group and combines results.
# Example: Return top 2 rows by Value1 within each group
top_2 = grouped_single.apply(lambda x: x.nlargest(2, 'Value1'))